Create a stacked bar chart of digit distribution, with a grouping variable on the x axis, and the distribution of digits in a particular digit place on the y axis.
Usage
stackedDigitChart(
  dfDigits,
  colGroup,
  colPlace,
  strGroupLabel = rlang::ensym(colGroup),
  strPlaceLabel = rlang::ensym(colPlace),
  strChartTitle =
    glue::glue("Digit Distribution for {strPlaceLabel} of Data by {strGroupLabel}"),
  scaleDigitPalette = ggplot2::scale_fill_brewer(palette = "Set3"),
  themePlot = ggplot2::theme_bw()
)
Arguments
- dfDigits
data.frameA data.frame with a grouping column and at least one column for a digit place.- colGroup
<
data-masked> The column to group by.- colPlace
<
data-masked> The column with the digit place to be plotted.- strGroupLabel
characterAn optional name to use for the grouping column in labels.- strPlaceLabel
characterAn optional name to use for the place column in labels.- strChartTitle
characterAn optional title for the chart.- scaleDigitPalette
An optional
ggplot2::scale_fill_discrete()palette to use for the digits.- themePlot
An optional
ggplot2::theme()to apply to the plot.
Examples
sample_data <- data.frame(
siteID = sample(c("siteA", "siteB", "siteC"), 1000, replace = TRUE),
onesPlace = sample(0:9, 1000, replace = TRUE)
)
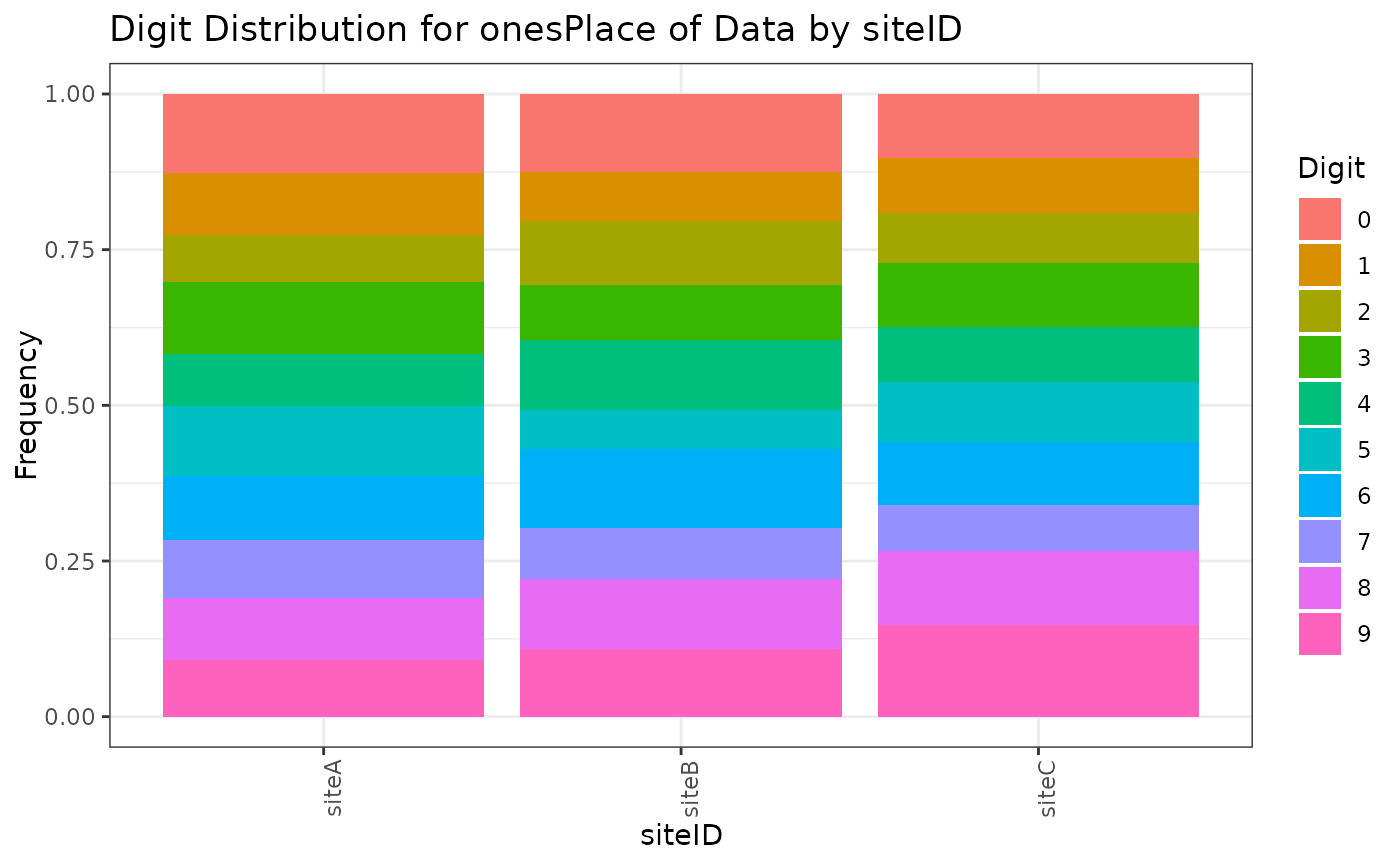
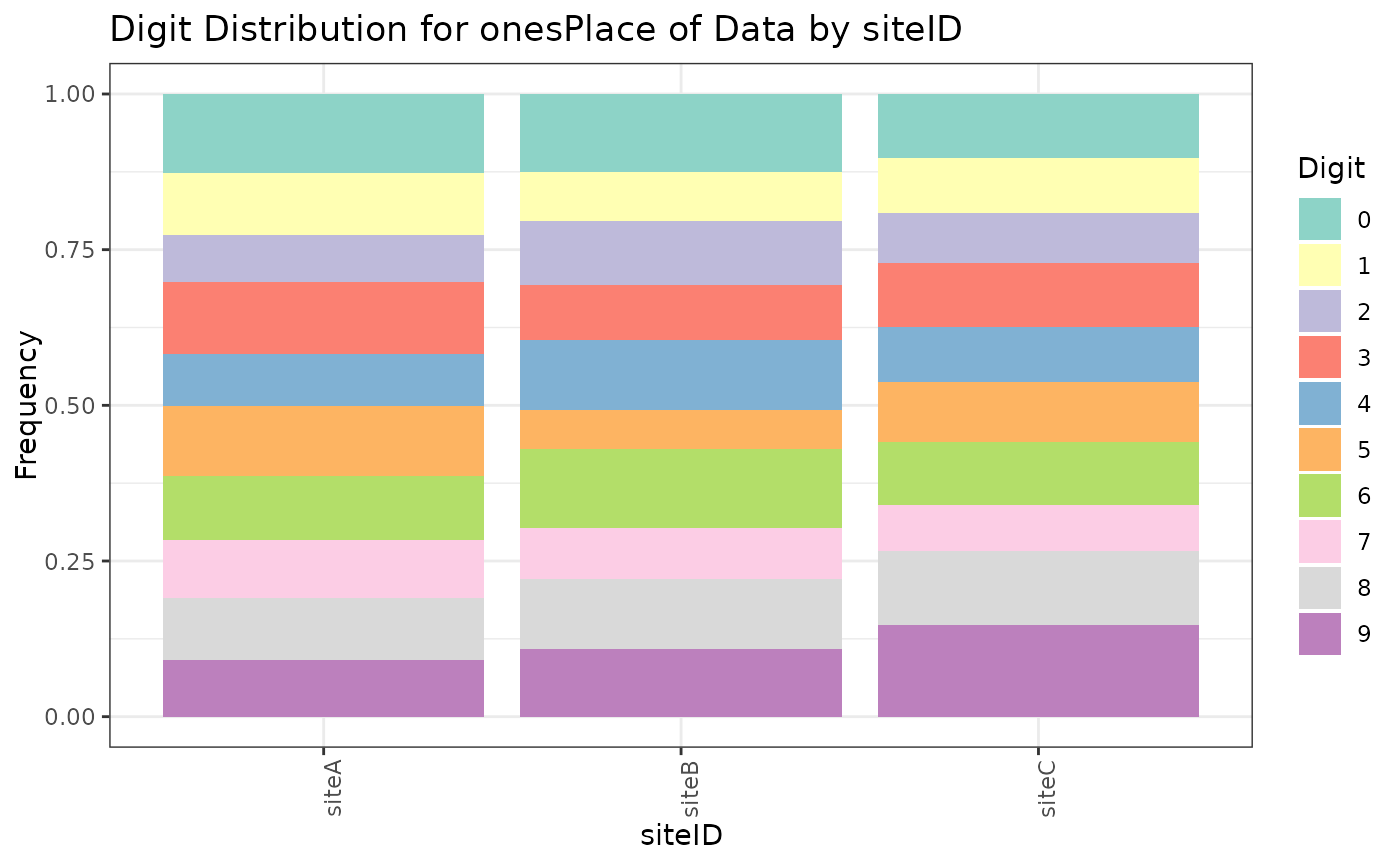
stackedDigitChart(sample_data, siteID, onesPlace)
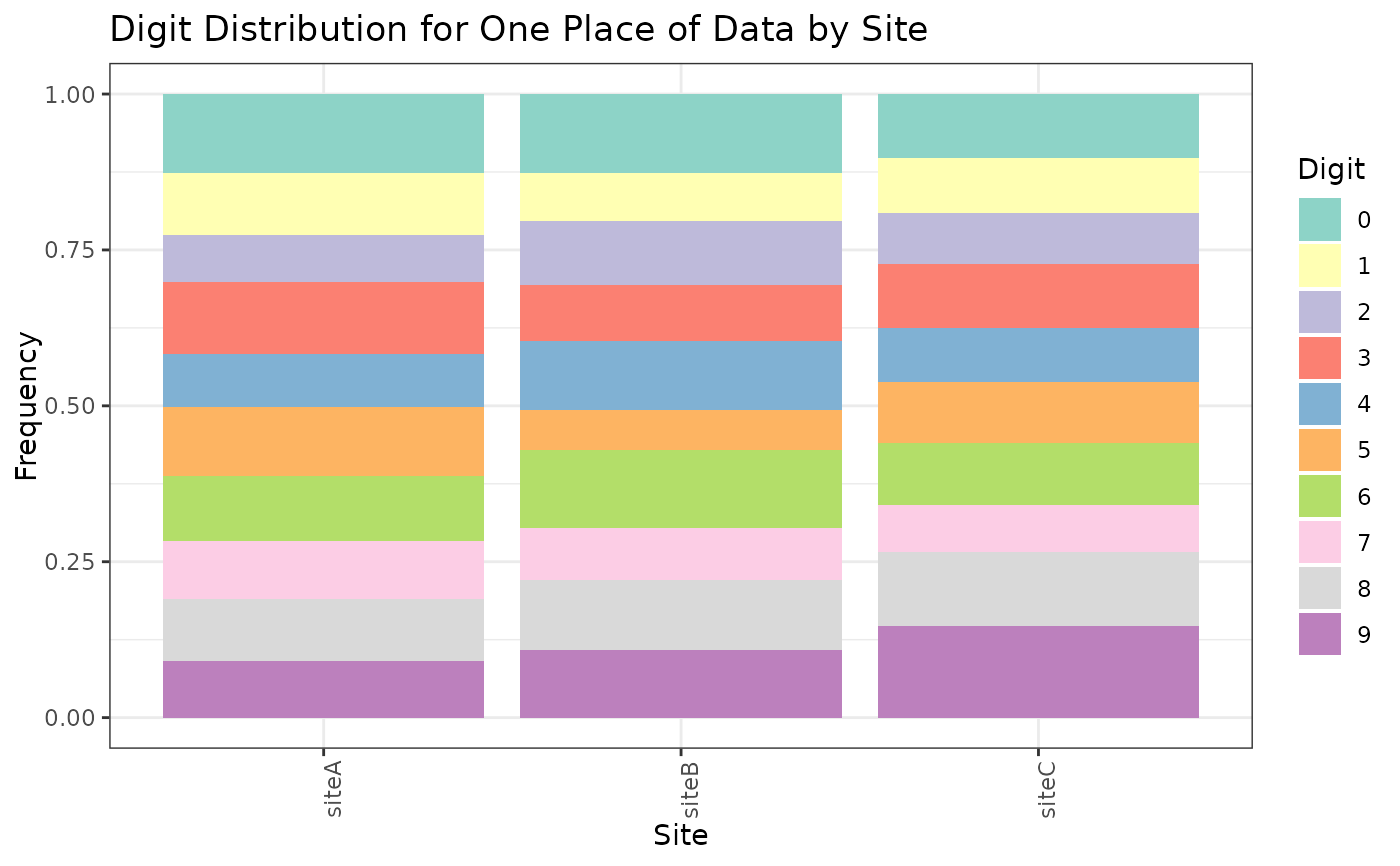
 stackedDigitChart(sample_data, siteID, onesPlace, "Site", "One Place")
 stackedDigitChart(sample_data, siteID, onesPlace, scaleDigitPalette = NULL)