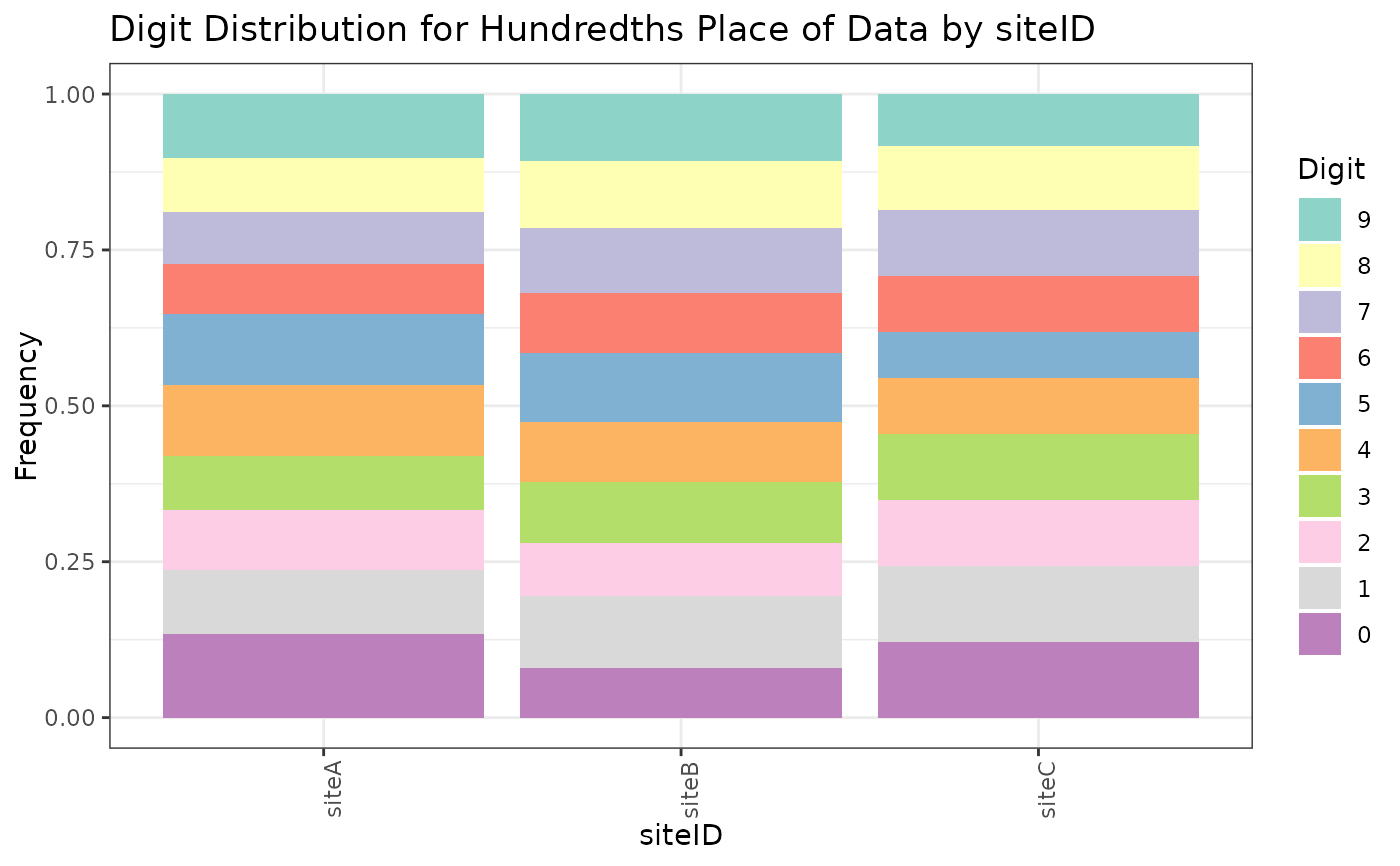
Create a stacked bar chart of digit distribution, with a grouping variable on the x axis, and the distribution of digits in a particular digit place on the y axis.
Usage
plotPlaceDigits(
  dfData,
  colData,
  colGroup,
  power_10,
  strGroupLabel = colGroup,
  strPlaceLabel = powerToOrdinal(power_10, strAfter = "Place"),
  strChartTitle =
    glue::glue("Digit Distribution for {strPlaceLabel} of Data by {strGroupLabel}"),
  scaleDigitPalette = ggplot2::scale_fill_brewer(palette = "Set3"),
  themePlot = ggplot2::theme_bw()
)
Arguments
- dfData
data.frameA data.frame with a grouping column and at least one numeric data column.- colData
characterThe name of a column that contains numeric data.- colGroup
characterThe name of a column to group by.- power_10
integerThe 10s place to check, as a power of 10.- strGroupLabel
characterAn optional name to use for the grouping column in labels.- strPlaceLabel
characterAn optional name to use for the place column in labels.- strChartTitle
characterAn optional title for the chart.- scaleDigitPalette
An optional
ggplot2::scale_fill_discrete()palette to use for the digits.- themePlot
An optional
ggplot2::theme()to apply to the plot.